Forex trading is a dynamic and potentially lucrative endeavor, but it requires a well-thought-out approach to navigate the constant fluctuations in the currency market. A solid trading strategy allows you to make informed decisions, manage risk effectively, and ultimately achieve consistent profits. In this article, we will explore various forex trading strategies, their characteristics, and how you can apply them to your own trading journey.
When selecting a forex trading strategy, it is essential to consider factors such as your trading style, risk tolerance, time horizon, and available resources. A well-chosen strategy should align with your goals and preferences, enabling you to trade confidently and consistently.
In this comprehensive guide, we will delve into several types of forex trading strategies, including trend trading, range trading, breakout trading, swing trading, position trading, scalping, news trading, algorithmic trading, and advanced trading strategies. Each chapter will provide an in-depth look at the respective strategy, along with examples and screenshots to help you understand and implement them effectively.
Table of Contents:
Trend Trading Strategies
Discover the power of following market trends and learn how to capitalize on them with effective trend trading strategies.
In this chapter, we’ll explore various techniques that can help you identify and ride trending markets, allowing you to potentially increase your profits while reducing your risks.
Moving Average Crossovers
A moving average crossover strategy involves using two or more moving averages to generate trading signals. Traders typically use a combination of a shorter and a longer-term moving average.
When the shorter-term moving average crosses above the longer-term moving average, it generates a buy signal, indicating a potential uptrend. Conversely, when the shorter-term moving average crosses below the longer-term moving average, it generates a sell signal, signifying a possible downtrend.
Example: Using a 50-day and a 200-day moving average on a currency pair’s daily chart. When the 50-day moving average crosses above the 200-day moving average, it may be an opportune time to buy. When the 50-day moving average crosses below the 200-day moving average, it may signal a good time to sell.

Trendlines and Channels
Trendlines are diagonal lines drawn on a price chart to identify and follow the direction of a trend. An upward trendline connects the lows of an uptrend, while a downward trendline connects the highs of a downtrend.
Channels are formed by parallel trendlines, with the lower trendline acting as support and the upper trendline as resistance. Trendline and channel trading strategies involve buying near the support trendline in an uptrend and selling near the resistance trendline in a downtrend.
Example: In an uptrend, a trader might look for opportunities to buy when the price approaches the support trendline. They would then set a stop loss below the trendline and a profit target near the resistance trendline of the channel. Conversely, in a downtrend, a trader might look to sell when the price approaches the resistance trendline, with a stop loss above the trendline and a profit target near the support trendline.

Parabolic SAR
The Parabolic Stop and Reverse (SAR) is a technical indicator that helps traders identify potential trend reversals and determine the direction of a trend.
The Parabolic SAR plots dots above or below the price chart, depending on the trend direction. When the dots are below the price, it indicates an uptrend, and when they are above the price, it suggests a downtrend. Traders can use the Parabolic SAR to generate trading signals by entering long positions when the dots move below the price and short positions when the dots move above the price.
Example: In an uptrend, a trader might enter a long position when the Parabolic SAR dots move below the price and exit when the dots move above the price, signaling a potential trend reversal. In a downtrend, a trader might enter a short position when the Parabolic SAR dots move above the price and exit when the dots move below the price, indicating a possible trend reversal.

MACD Divergence
The Moving Average Convergence Divergence (MACD) is a momentum indicator that measures the difference between two exponential moving averages (usually the 12-day and 26-day EMAs) and compares it to a signal line (typically a 9-day EMA of the MACD line).
The MACD is particularly useful for identifying divergences between price action and the indicator, which can signal potential trend reversals. A bullish divergence occurs when the price makes a lower low while the MACD makes a higher low, suggesting a possible reversal to the upside. Conversely, a bearish divergence occurs when the price makes a higher high while the MACD makes a lower high, indicating a potential reversal to the downside.
Example: A trader might look for a bullish divergence between the price and the MACD as a signal to enter a long position in anticipation of a trend reversal. They would then set a stop loss below the recent swing low and a profit target based on their desired risk-to-reward ratio. Similarly, a trader might look for a bearish divergence to enter a short position, with a stop loss above the recent swing high and a profit target determined by their risk-to-reward preferences.

Conclusion
Trend trading strategies aim to capitalize on market trends by identifying and following the direction of a trend. By using various tools and techniques such as moving average crossovers, trendlines, channels, Parabolic SAR, and MACD divergences, traders can generate buy and sell signals to profit from the continuation or reversal of a trend.
The key to successful trend trading is to remain patient, disciplined, and adaptable, as market conditions can change rapidly. Combining these strategies with sound risk management and a thorough understanding of the underlying market dynamics can significantly improve your chances of success in forex trading.
Brokers for Trend Trading

Range Trading Strategies
Master the art of trading in sideways markets with range trading strategies. In this chapter, we’ll delve into the intricacies of range-bound markets and share valuable insights on how to identify and exploit opportunities within them.
Learn how to navigate these choppy waters and develop forex trading strategies that work in markets that lack a clear directional bias.
Support and Resistance Levels
Support and resistance levels are horizontal price levels that indicate where buying or selling pressure may be concentrated.
Support levels represent areas where the price has struggled to move lower in the past, while resistance levels represent areas where the price has struggled to move higher. Range trading strategies involve buying near support levels and selling near resistance levels in a market that is moving sideways or consolidating.
Example: A trader identifies a currency pair that has been trading within a range between a support level at 1.1000 and a resistance level at 1.1200. They might place a buy order near the 1.1000 support level with a stop loss below the support and a profit target near the 1.1200 resistance level. Similarly, they could place a sell order near the 1.1200 resistance level with a stop loss above the resistance and a profit target near the 1.1000 support level.

Bollinger Bands
Bollinger Bands are a volatility-based indicator that consists of a simple moving average (usually a 20-day SMA) and two standard deviations above and below the moving average.
When the bands are tight, it indicates low volatility, which may signal the beginning of a breakout or trend. When the bands are wide, it suggests high volatility and the potential for a reversal. Range trading strategies using Bollinger Bands involve buying when the price touches the lower band and selling when the price touches the upper band in a sideways market.
Example: A trader might use a 20-day simple moving average with 2 standard deviations for the Bollinger Bands. When the price touches the lower band, they might enter a long position with a stop loss below the recent swing low and a profit target near the upper band. Conversely, when the price touches the upper band, they might enter a short position with a stop loss above the recent swing high and a profit target near the lower band.

RSI Overbought and Oversold Levels
The Relative Strength Index (RSI) is a momentum oscillator that measures the speed and change of price movements on a scale of 0 to 100.
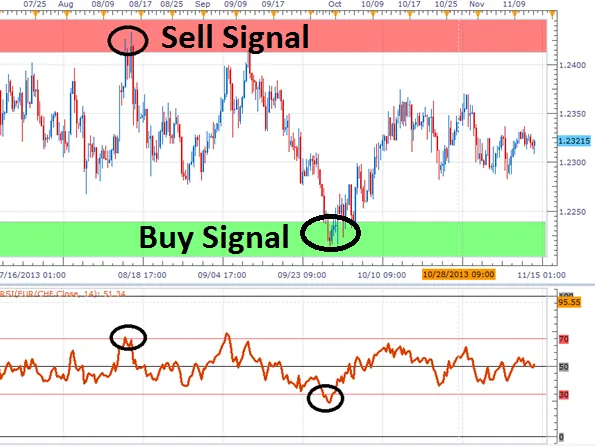
An RSI reading above 70 is considered overbought, indicating that the market may be due for a pullback, while an RSI reading below 30 is considered oversold, suggesting that a rally may be imminent. Range trading strategies using the RSI involve buying when the indicator is in the oversold territory and selling when it is in the overbought territory.
Example: A trader might look for opportunities to buy when the RSI falls below 30 and rises back above it, signaling a potential reversal to the upside. They would then set a stop loss below the recent swing low and a profit target near a previously identified resistance level. Similarly, a trader might look for opportunities to sell when the RSI rises above 70 and falls back below it, signaling a potential reversal to the downside. They would then set a stop loss above the recent swing high and a profit target near a previously identified support level.
Stochastic Oscillator
The Stochastic Oscillator is another momentum indicator that compares a security’s closing price to its price range over a given time period.
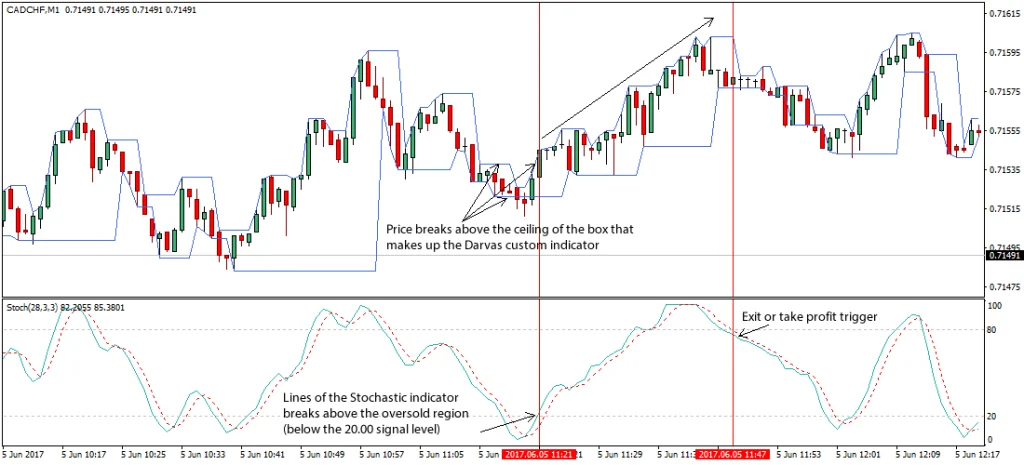
Like the RSI, the Stochastic Oscillator ranges from 0 to 100, with overbought levels generally above 80 and oversold levels below 20. Range trading strategies using the Stochastic Oscillator involve buying when the indicator moves out of the oversold area and selling when it moves out of the overbought area.
Example: A trader might look for a bullish crossover of the Stochastic Oscillator’s %K and %D lines in the oversold territory as a signal to enter a long position. They would then set a stop loss below the recent swing low and a profit target near the identified resistance level. On the other hand, a trader might look for a bearish crossover in the overbought territory as a signal to enter a short position, with a stop loss above the recent swing high and a profit target near the identified support level.

Conclusion
Range trading strategies can be an effective way to profit from sideways or consolidating markets when there is a lack of a strong trend. By utilizing tools and techniques such as support and resistance levels, Bollinger Bands, RSI, and the Stochastic Oscillator, traders can identify potential entry and exit points for their trades. It is essential to practice sound risk management and remain disciplined when using these forex trading strategies, as markets can transition from a range-bound state to a trending state without warning.
In conclusion, understanding and implementing a variety of forex trading strategies can help traders adapt to different market conditions and ultimately increase their profitability. Whether employing trend-following, range trading, or advanced strategies, it is crucial to develop a solid trading plan, practice sound risk management, and continuously refine your skills through ongoing education and experience. By doing so, you can increase your chances of success in the dynamic world of forex trading.
Brokers for Range Trading

IC Markets
Breakout Trading Strategies
Breakout trading strategies focus on identifying and capitalizing on significant price movements that occur when a currency pair breaks out of a well-defined support or resistance level.
These strategies are popular among forex traders because they can offer high reward-to-risk ratios and provide clear entry and exit signals. In this chapter, we will explore different types of breakout strategies and how to implement them effectively in your trading.
Horizontal Breakouts
Horizontal breakouts occur when a currency pair’s price breaks through a horizontal support or resistance level. To trade horizontal breakouts, traders need to identify the key support and resistance levels on their charts and wait for a strong price movement to confirm the breakout.
Example: A trader identifies a range-bound currency pair with well-defined support and resistance levels. They set buy stop orders slightly above the resistance level and sell stop orders slightly below the support level. When the price breaks through either level, the corresponding order is triggered, and the trader aims to capture the subsequent price movement, setting a stop loss near the breached level and a profit target based on their desired reward-to-risk ratio.

Trendline Breakouts
Trendline breakouts occur when the price of a currency pair breaks through a trendline that has been acting as support or resistance. This type of breakout often signifies a potential reversal or continuation of the existing trend.
Example: A trader identifies an uptrend in a currency pair and draws a trendline connecting the higher lows. They monitor the price action closely and wait for a decisive break below the trendline, signaling a potential trend reversal. Upon confirmation of the breakout, the trader enters a short position with a stop loss above the recent swing high and a profit target based on their desired reward-to-risk ratio. Conversely, if the trader identifies a downtrend, they would draw a trendline connecting the lower highs and wait for a break above the trendline to initiate a long position.

Channel Breakouts
Channel breakouts occur when a currency pair’s price breaks out of a parallel channel, which consists of two parallel trendlines that contain the price action. Channel breakouts can signify a trend reversal or a strong continuation of the existing trend.
Example: A trader identifies a currency pair trading within a well-defined channel and waits for a breakout in either direction. If the price breaks above the upper trendline, the trader enters a long position with a stop loss below the recent swing low and a profit target based on their desired reward-to-risk ratio. If the price breaks below the lower trendline, the trader enters a short position with a stop loss above the recent swing high and a profit target accordingly.

Volatility Breakouts
Volatility breakouts occur when the price of a currency pair experiences a sudden increase in volatility and breaks out of a previously established trading range. Traders can use technical indicators such as the Average True Range (ATR) or Bollinger Bands to identify periods of low volatility and anticipate potential breakouts.
Example: A trader applies the Bollinger Bands indicator to their chart and notices that the bands are narrowing, indicating a period of low volatility. They set buy stop orders above the upper Bollinger Band and sell stop orders below the lower Bollinger Band, anticipating a volatility breakout in either direction. When the price breaks out, the corresponding order is triggered, and the trader aims to capture the subsequent price movement, setting a stop loss near the breached Bollinger Band and a profit target based on their desired reward-to-risk ratio.

News and Event-Driven Breakouts
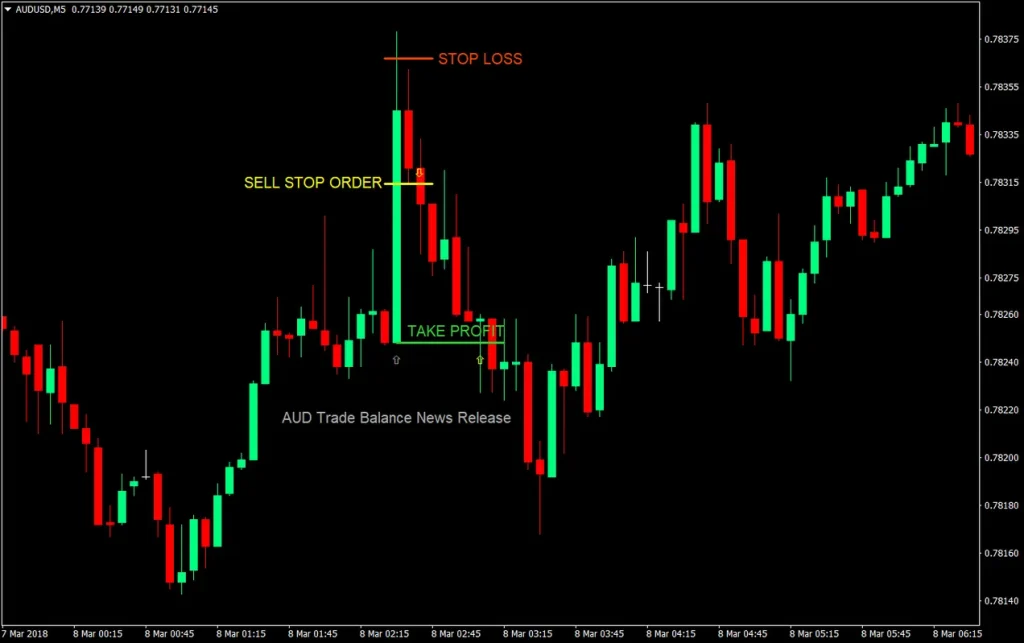
News and event-driven breakouts occur when the release of significant economic data or unexpected news events trigger sharp price movements in the market. Traders who specialize in news and event-driven forex trading strategies need to stay informed about upcoming economic releases, central bank decisions, and geopolitical events that can impact the forex market.
Example: A trader closely follows economic news and is aware of an upcoming central bank interest rate decision. They monitor the market’s reaction to the news release and identify a strong price movement that breaks through a key support or resistance level. The trader then enters a position in the direction of the breakout, setting a stop loss near the breached level and a profit target based on their desired reward-to-risk ratio.
Conclusion
Breakout trading strategies can offer forex traders the opportunity to capitalize on significant price movements in the market. By understanding the different types of breakouts and implementing the appropriate strategy, traders can improve their chances of success and potentially generate consistent returns. As always, effective risk management and discipline are essential to achieving long-term success in forex trading.
Brokers for Breakout Trading


Swing Trading Strategies
Swing trading strategies involve capturing price swings in the market by entering and exiting positions over a relatively short time frame, typically ranging from a few days to several weeks.
These strategies aim to take advantage of short-term market trends and price fluctuations, allowing traders to profit from the natural ebb and flow of the forex market. In this chapter, we’ll discuss several popular swing trading strategies, along with examples to illustrate their application.
Fibonacci Retracements
Fibonacci retracements are a popular swing trading tool used to identify potential support and resistance levels in the market. Traders can apply the Fibonacci retracement tool to a price swing by connecting the swing high and low. The tool will then generate a series of retracement levels, which can serve as potential entry points for swing trades.
Example: A trader identifies a significant price swing on a currency pair and applies the Fibonacci retracement tool to the swing high and low. They observe that the price retraces to the 38.2% Fibonacci level and bounces, indicating a potential long entry. The trader enters a long position, setting a stop loss below the recent swing low and a profit target at the next resistance level.

Moving Average Confluence
Moving average confluence involves using multiple moving averages to identify potential areas of support and resistance, which can serve as entry and exit points for swing trades. By applying different time frames for the moving averages, traders can gain insights into the short-term and long-term trends of the market.
Example: A trader applies a 50-period and a 200-period moving average to their chart. When the price approaches the confluence of both moving averages and shows signs of a reversal (e.g., a bullish candlestick pattern), they enter a long position. The trader sets a stop loss below the recent swing low and a profit target at the next resistance level.

RSI Divergence
The Relative Strength Index (RSI) is a popular momentum indicator used in swing trading strategies. RSI divergence occurs when the price forms higher highs or lower lows, while the RSI forms lower highs or higher lows. This divergence can signal a potential trend reversal, providing an opportunity for swing traders to enter the market.
Example: A trader observes a currency pair forming higher highs on the price chart, while the RSI forms lower highs. This bearish RSI divergence suggests that the upward momentum is weakening, and a potential trend reversal may be imminent. The trader enters a short position, setting a stop loss above the recent swing high and a profit target at the next support level.

Conclusion
In conclusion, swing trading strategies offer traders a range of opportunities to profit from short-term price fluctuations in the forex market. By utilizing tools such as Fibonacci retracements, moving average confluence, and RSI divergence, swing traders can identify potential entry and exit points with a higher probability of success. It’s essential for traders to combine these strategies with sound risk management principles, such as setting appropriate stop losses and profit targets, to maximize their potential returns while minimizing potential losses.
When applying these swing trading strategies, it’s crucial to remain patient and disciplined. Waiting for the right market conditions and setups to materialize will often yield better results than trying to force trades in unfavorable conditions. Additionally, it’s important to continually monitor and evaluate the effectiveness of your swing trading strategies, making adjustments as needed to improve performance over time.
By combining the swing trading strategies mentioned in this chapter with a solid understanding of market dynamics and technical analysis, traders can greatly enhance their chances of success in the forex market. Remember, the key to successful swing trading lies in the ability to adapt to changing market conditions and maintain a disciplined approach to risk management.
Brokers for Swing Trading
IC Markets
Position Trading Strategies
Position trading strategies differ from other trading approaches in that they focus on holding trades for more extended periods, typically from several weeks to months or even years.
This long-term perspective allows position traders to take advantage of more significant price trends and minimize the impact of short-term market noise. In this chapter, we’ll explore several popular position trading strategies and provide examples to help illustrate their application in the forex market.
Multi-Timeframe Analysis
Multi-timeframe analysis involves examining currency pairs on multiple timeframes to gain a broader perspective on the market’s direction. By analyzing long-term trends and identifying key support and resistance levels, position traders can enter trades with a higher probability of success.
Example: A trader examines a currency pair on the monthly, weekly, and daily timeframes. They identify a long-term uptrend on the monthly chart and find key support and resistance levels on the weekly and daily charts. By entering trades at these levels, the trader can take advantage of the long-term trend while managing risk effectively.
Fundamental Analysis and Sentiment
Fundamental analysis and sentiment play a crucial role in position trading strategies, as they can help traders gauge the long-term direction of a currency pair.
By assessing economic indicators, central bank policies, and market sentiment, position traders can gain insights into the underlying factors driving the market and make more informed trading decisions.
Example: A trader analyzes the economic health of two countries whose currencies are paired together. They consider factors such as GDP growth, inflation, and interest rates, as well as the overall market sentiment. If one country’s economy appears to be significantly stronger than the other, the trader may enter a long position on that country’s currency, expecting it to appreciate over time.
Carry Trade Strategy
The carry trade strategy is a popular position trading approach that involves buying a currency with a high-interest rate and selling a currency with a low-interest rate.
The goal of the carry trade is to profit from the interest rate differential between the two currencies, as well as any potential capital appreciation.
Example: A trader identifies a currency pair with a significant interest rate differential, such as the AUD/JPY. They buy the higher-yielding currency (AUD) and sell the lower-yielding currency (JPY). As long as the interest rate differential remains in their favor, the trader earns interest on the trade, which is credited to their account daily. Additionally, if the higher-yielding currency appreciates against the lower-yielding currency, the trader can also benefit from capital gains.
Conclusion
In conclusion, position trading strategies offer a long-term approach to forex trading, allowing traders to capitalize on more significant price trends while minimizing the impact of short-term market fluctuations. By employing multi-timeframe analysis, fundamental analysis and sentiment, and the carry trade strategy, position traders can enhance their chances of success in the forex market.
As with any trading approach, it’s essential for position traders to practice sound risk management principles, such as setting appropriate stop losses and profit targets. Additionally, remaining patient and disciplined in waiting for the right market conditions and setups to materialize is crucial to achieving long-term success with position forex trading strategies.
Finally, it’s important to remember that position trading is not suitable for everyone, as it requires a longer time horizon and a willingness to hold trades for extended periods. Traders should carefully consider their risk tolerance, investment objectives, and trading style before committing to a position trading approach. By doing so, they can better align their strategies with their unique goals and preferences, ultimately increasing their chances of success in the forex market.
Brokers for Position Trading
Scalping Strategies
Scalping strategies are a popular approach for forex traders who seek to profit from small price movements in the market. These strategies typically involve entering and exiting trades quickly, often within minutes or even seconds.
Scalpers aim to capitalize on numerous small gains throughout the trading day, rather than trying to capture larger price swings. Here, we’ll discuss three popular scalping strategies: 1-minute scalping, stochastic scalping, and Bollinger Band and RSI scalping.
1-Minute Scalping
The 1-minute scalping strategy is a simple yet effective approach that involves trading on the 1-minute time frame.
Traders look for short-term price trends and enter trades with the expectation of closing them within a matter of minutes. Technical indicators, such as moving averages and MACD, can be used to identify potential entry and exit points.
Example: A trader uses a 10-period simple moving average (SMA) and a 50-period SMA on a 1-minute chart. When the 10-period SMA crosses above the 50-period SMA, the trader enters a long position. Conversely, when the 10-period SMA crosses below the 50-period SMA, the trader enters a short position. The trader sets tight stop losses and profit targets, often closing the trade within just a few minutes.

Stochastic Scalping
Stochastic scalping involves using the stochastic oscillator, a popular momentum indicator, to identify overbought and oversold conditions in the market. The strategy aims to capitalize on short-term price reversals by entering trades when the stochastic oscillator signals a potential reversal.
Example: A trader applies the stochastic oscillator to a 5-minute chart and looks for instances when the oscillator crosses the 80 (overbought) or 20 (oversold) levels. When the oscillator crosses below the 80 level, the trader enters a short position, anticipating a price reversal to the downside. Conversely, when the oscillator crosses above the 20 level, the trader enters a long position, expecting a price reversal to the upside. As with other scalping strategies, tight stop losses and profit targets are employed.
Bollinger Band and RSI Scalping
The Bollinger Band and RSI scalping strategy combines two popular technical indicators to identify potential trade setups. Bollinger Bands measure price volatility, while the Relative Strength Index (RSI) assesses momentum. By combining these indicators, traders can identify overbought or oversold conditions and potential price reversals.
Example: A trader applies Bollinger Bands and the RSI to a 5-minute chart. They look for instances when the price touches the upper Bollinger Band and the RSI is above the 70 level, signaling overbought conditions. In this case, the trader enters a short position, anticipating a price reversal to the downside. On the other hand, when the price touches the lower Bollinger Band and the RSI is below the 30 level, indicating oversold conditions, the trader enters a long position, expecting a price reversal to the upside. As with other scalping strategies, it is crucial to use tight stop losses and profit targets to manage risk effectively.
Conclusion
In conclusion, scalping strategies can be an effective approach for forex traders looking to capitalize on small price movements. These strategies require quick decision-making and a strong understanding of technical indicators. As always, proper risk management and discipline are essential to achieving success with these strategies. Whether you choose to employ one of these scalping methods or develop your own, remember to practice and refine your approach to maximize its potential.
News Trading Strategies
News trading strategies revolve around taking advantage of market volatility generated by significant economic news releases and events.
By closely monitoring these events, traders can capitalize on the price fluctuations that often follow. In this chapter, we’ll explore three popular news trading strategies that can help you take advantage of market-moving news.
News trading is also very risky cause of widening of spreads during economic news. You have to remember about it.
Economic Calendar Trading
Economic calendar trading involves monitoring and trading based on scheduled economic events and data releases. Traders use economic calendars to stay informed about upcoming events and to prepare for potential market volatility. By understanding the potential impact of these events, traders can make informed decisions about when to enter or exit trades.
Example: A trader reviews the economic calendar for the week ahead and identifies a scheduled interest rate announcement from the European Central Bank (ECB). They analyze the potential market reaction to different scenarios and decide on a trading strategy. Once the news is released, the trader executes their strategy based on the actual data and market reaction.

Trading the NFP (Non-Farm Payroll)
The Non-Farm Payroll (NFP) report is a significant monthly U.S. economic data release that has a considerable impact on the forex market.
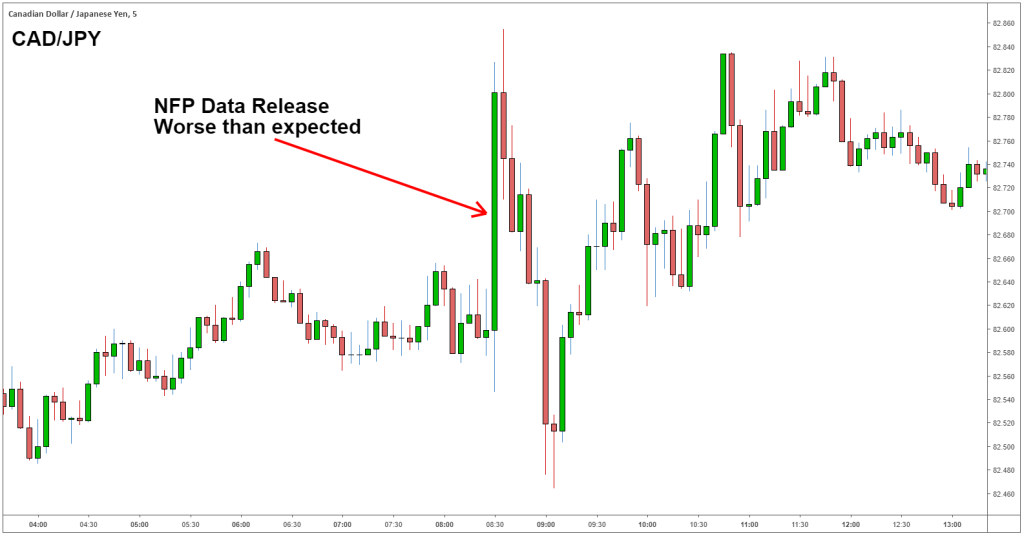
The NFP report provides information about the change in the number of employed people, excluding the farming sector. Traders closely watch this report, as it can influence monetary policy decisions and affect the U.S. dollar’s value. Trading the NFP involves anticipating the market’s reaction to the data and capitalizing on the resulting price movements.
Example: A trader waits for the NFP report to be released, paying close attention to the actual numbers compared to the market’s expectations. If the data comes in significantly better or worse than expected, the trader enters a position in line with the anticipated market reaction. For instance, if the NFP data is much stronger than anticipated, the trader might buy the U.S. dollar, expecting it to strengthen against other currencies.
Fade the News Strategy
The fade the news strategy involves taking a contrarian position in response to a significant news release. Traders using this strategy anticipate that the initial market reaction to the news will be overdone and that the price will eventually revert to its pre-news levels.
This approach can be particularly effective when the market has already priced in the news or when the initial reaction is based on an overreaction to the news.
Example: A company releases better-than-expected earnings, and its stock price surges in the minutes following the announcement. A trader employing the fade the news strategy believes that the market has overreacted to the news and that the stock’s price will eventually fall back to its pre-announcement level. The trader enters a short position, aiming to profit from the expected price reversion.
Conclusion
In conclusion, new strading strategies offer traders the opportunity to capitalize on the market volatility generated by significant economic news and events. By staying informed about these events and understanding their potential impact on the market, traders can develop and execute strategies that allow them to profit from price fluctuations.
It’s essential to remember that trading the news carries inherent risks and requires a solid understanding of market dynamics, as well as the ability to react quickly to changing conditions. As always, proper risk management and a disciplined approach are crucial for success in news trading.
Brokers for Scalping
IC Markets
Algorithmic Trading Strategies
Algorithmic trading strategies involve using computer algorithms and programming to execute trades in the financial markets. These strategies are often designed to capitalize on specific market conditions or patterns and can provide traders with a systematic and disciplined approach to trading.
With algorithmic trading, human emotions are minimized, and trades can be executed with greater speed and precision. Let’s explore three popular algorithmic trading strategies.
Moving Average Crossover Algorithm
The moving average crossover algorithm is a simple yet effective strategy based on the concept of moving averages. This algorithm generates buy and sell signals when a short-term moving average crosses a long-term moving average. Typically, a buy signal is generated when the short-term moving average crosses above the long-term moving average, while a sell signal is generated when the short-term moving average crosses below the long-term moving average.
Example: A trader uses a 50-day simple moving average (SMA) and a 200-day SMA to create a moving average crossover algorithm. When the 50-day SMA crosses above the 200-day SMA, the algorithm generates a buy signal. Conversely, when the 50-day SMA crosses below the 200-day SMA, the algorithm generates a sell signal.
Grid Trading Algorithm
Grid trading is an algorithmic strategy that involves placing multiple buy and sell limit orders at predefined price levels (the grid) within a trading range. This strategy aims to profit from the natural fluctuations of the market by capturing gains on both up and down price movements. The grid trading algorithm is designed to work in ranging or sideways markets and is typically not suitable for trending markets.
Example: A trader sets up a grid trading algorithm with a predefined range of 100 pips and places buy and sell limit orders every 10 pips within this range. When the market moves up and down within the grid, the algorithm will execute the buy and sell orders, capturing profits from the price fluctuations.
Breakout Trading Algorithm
Breakout trading algorithms are designed to capitalize on significant price movements following a period of consolidation or when the price breaks through an established support or resistance level. The algorithm monitors price action and generates buy or sell signals when a breakout occurs.
Example: A trader sets up a breakout trading algorithm that monitors a currency pair for a breakout from a predefined trading range, such as a consolidation pattern or a trendline. When the price breaks above the resistance level, the algorithm generates a buy signal. If the price breaks below the support level, the algorithm generates a sell signal.
Conclusion
In conclusion, algorithmic trading strategies can provide traders with a systematic approach to trading, reducing emotional decision-making and increasing speed and precision in trade execution. It’s essential to choose an algorithmic strategy that aligns with your trading style, risk tolerance, and market conditions.
Remember that, like any trading strategy, algorithmic trading carries risks, and it is crucial to thoroughly test and optimize your algorithms before deploying them in live market conditions. By understanding and implementing these strategies, you can potentially enhance your trading performance and achieve better results in the financial markets.
Brokers for Algorithmic Trading
IC Markets
Advanced Forex Trading Strategies
Advanced forex trading strategies are designed for experienced traders who are looking to refine their approach and improve their trading performance. These strategies incorporate sophisticated techniques and multiple tools to help identify high-probability trade setups while managing risk effectively.
In this chapter, we will explore three advanced forex trading strategies: risk management techniques, trading divergences, and using multiple indicators.
Risk Management Techniques
Risk management is a crucial aspect of successful trading. Advanced traders use various techniques to minimize risk and protect their trading capital. Some of these techniques include position sizing, stop-loss orders, and trailing stops.
Example: A trader decides to risk only 1% of their trading account on each trade. They use a position sizing calculator to determine the appropriate lot size for each trade based on their stop-loss placement. The trader also employs a trailing stop to lock in profits as the market moves in their favor.
Using Multiple Indicators
Advanced traders often use multiple technical indicators to confirm trade signals and increase the probability of success. By combining different types of indicators, traders can filter out false signals and improve their decision-making process.
Example: A trader uses a combination of a moving average, the Relative Strength Index (RSI), and the Bollinger Bands to identify high-probability trade setups. They look for price action to break above the moving average, the RSI to move above a certain threshold, and the price to touch the upper Bollinger Band. When all three conditions are met, the trader considers entering a long position.
Conclusion
In conclusion, advanced forex trading strategies provide experienced traders with a more sophisticated approach to the markets. By incorporating risk management techniques, trading divergences, and using multiple indicators, traders can potentially enhance their performance and achieve better results. Remember, however, that no strategy guarantees success, and it is essential to continue refining your approach and adapting to changing market conditions.
Developing and Testing Your Own Forex Trading Strategy
As you gain experience in the forex market, you may find that you want to develop and test your own trading strategy.
This chapter will provide a step-by-step guide to help you identify your trading style, define your trading goals, backtest and forward test your strategy, and fine-tune it to adapt to changing market conditions.
Identifying Your Trading Style
The first step in developing your own forex trading strategy is to identify your trading style. This will depend on factors such as your risk tolerance, time commitment, and personal preferences.
Some common trading styles include scalping, day trading, swing trading, and position trading. It’s essential to choose a style that suits your personality and circumstances to increase the likelihood of long-term success.
Defining Your Trading Goals
Next, you should define your trading goals, which will help you stay focused and measure your progress. Set realistic and achievable goals that are specific, measurable, and time-bound. Consider factors such as your desired return on investment, risk-to-reward ratio, and the number of trades you aim to execute per day, week, or month.
Backtesting and Forward Testing
Once you have identified your trading style and set your goals, it’s time to develop a trading strategy and test it. Backtesting involves using historical price data to evaluate the effectiveness of your strategy.
By applying your strategy to historical data, you can assess its performance and identify any potential issues or areas for improvement. There are various backtesting tools and software available, such as MetaTrader’s Strategy Tester, that can help automate this process.
After backtesting, forward testing, also known as paper trading, is the next step. This involves testing your strategy in real-time using a demo account or simulated trading environment.
Forward testing allows you to see how your strategy performs under current market conditions and provides an opportunity to make any necessary adjustments before using real capital.
Fine-Tuning and Adapting Your Strategy
Once you have tested your trading strategy through both backtesting and forward testing, you may need to fine-tune it to optimize its performance. This could involve adjusting your entry and exit rules, modifying your risk management techniques, or incorporating additional indicators.
It’s crucial to remember that the forex market is continuously evolving, and your trading strategy should be adaptable to these changes. Regularly reviewing and updating your strategy based on your trading performance and market conditions will help you stay ahead of the curve and improve your chances of success in the long run.
Common Mistakes and Traps in Forex Trading Strategies
As a forex trader, it is essential to be aware of the potential mistakes and traps that can occur when using various trading strategies. In this chapter, we will discuss some of the most common errors and pitfalls that traders may encounter and provide guidance on how to avoid them.
- Overtrading and Lack of Discipline
Overtrading occurs when traders place too many trades in a short period, often driven by the desire to make quick profits. This can lead to poor decision-making and a lack of discipline, which can cause significant losses. To avoid overtrading, establish clear trading rules and follow them consistently. - Ignoring Risk Management
Risk management is crucial to successful forex trading. Ignoring risk management can lead to large losses that may be difficult to recover from. Always use stop-loss orders, set realistic profit targets, and maintain a balanced risk-reward ratio in your trading strategy. - Overreliance on Technical Analysis or Indicators
While technical analysis and indicators can provide valuable insights, relying solely on them can be a mistake. It’s essential to combine technical analysis with fundamental analysis and other trading tools to develop a well-rounded trading strategy. - Failing to Adapt to Changing Market Conditions
Market conditions can change rapidly, and traders must be prepared to adapt their strategies accordingly. Failing to adjust to changing market conditions can result in losses. Continually evaluate your trading strategy and make necessary adjustments to stay profitable. - Inadequate Testing and Validation of Strategies
Before implementing a trading strategy, it’s vital to test and validate its effectiveness. Inadequate testing can lead to implementing a strategy that may not be profitable or suitable for your trading style. Backtest your strategy using historical data and forward test it in a demo account before committing to live trading. - Emotional Trading
Trading based on emotions, such as fear or greed, can lead to poor decision-making and losses. Develop a solid trading plan and stick to it, regardless of your emotions. Practicing mindfulness and staying disciplined can help prevent emotional trading. - Not Keeping a Trading Journal
A trading journal is an essential tool for tracking your trades, analyzing your performance, and identifying areas for improvement. Failing to maintain a trading journal can make it difficult to learn from your mistakes and improve your trading strategy. Regularly update your trading journal with details of each trade, including the entry and exit points, reasons for the trade, and any lessons learned. - Insufficient Capital
Trading with insufficient capital can limit your ability to manage risk, recover from losses, and implement your trading strategy effectively. Ensure you have enough capital to support your trading goals and risk tolerance. - Unrealistic Expectations
Having unrealistic expectations of your trading performance can lead to disappointment, frustration, and poor decision-making. Set realistic goals and be patient, as successful trading often takes time and consistent effort.
By being aware of these common mistakes and traps in forex trading strategies, you can take steps to avoid them and improve your overall trading performance. Maintaining discipline, following a solid trading plan, and continuously learning from your experiences are essential aspects of successful forex trading.
Conclusion: Choosing the Right Forex Trading Strategy for You
In conclusion, finding the right forex trading strategy for your unique trading style, goals, and risk tolerance is essential for long-term success in the forex market. We have explored a wide range of strategies in this article, from the basic to the advanced, each with its own set of advantages and challenges. It is crucial to remember that there is no one-size-fits-all approach to forex trading, and the best strategy for one trader may not be suitable for another.
Take the time to understand each strategy and its underlying principles, test them through backtesting and forward testing, and fine-tune them based on your personal preferences and goals. Developing and implementing a well-researched, tested, and adaptable trading strategy will ultimately increase your chances of success in the ever-changing world of forex trading.
It is also important to stay up-to-date with the latest market developments and continuously educate yourself on new trading techniques and strategies. By doing so, you will be better equipped to navigate the complex world of forex trading and achieve your financial goals.